Energy Markets in 2026: Production, Storage, and Regulatory Dynamics
The global energy landscape continues to evolve under a complex interplay of technical, economic, and geopolitical forces. In 2026, the sector remains divided between traditional fossil‑fuel production and rapidly expanding renewable power, yet both are subject to the same macro‑level pressures that shape supply, demand, and capital flows. This analysis dissects the key drivers behind production trends, storage capabilities, and regulatory frameworks, while highlighting how geopolitical events influence the balance between conventional and renewable energy markets.
1. Production Trends Across the Energy Spectrum
1.1 Fossil Fuels
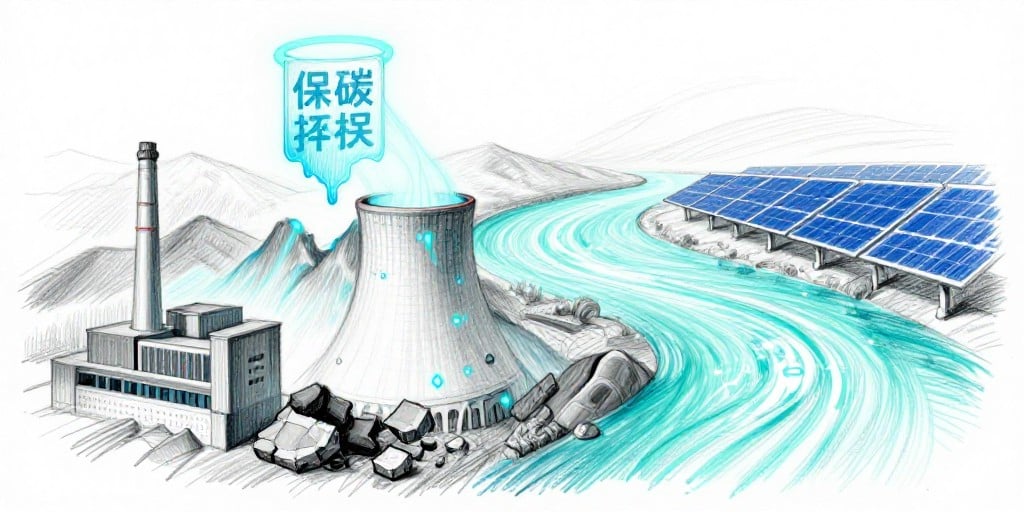
Oil and natural‑gas output in the United States and Europe has reached a plateau, driven by a combination of resource depletion and tighter environmental policies. In the Gulf Cooperation Council (GCC), new drilling projects continue to boost output, but the region faces a gradual shift toward lower‑carbon exports as the European Union tightens its carbon border adjustment mechanism. Meanwhile, China’s coal consumption remains stubbornly high in the short term, yet the country has accelerated its transition to natural gas and nuclear power as part of its 2035 carbon neutrality pledge.
1.2 Renewable Energy
Solar photovoltaic (PV) installations have expanded at an average annual rate of 12 % worldwide, outpacing wind capacity additions of 9 %. Technological breakthroughs in perovskite‑based cells and offshore floating wind farms have lowered the levelised cost of energy (LCOE) to below $30 per megawatt‑hour in many regions, making renewables competitive with gas in new projects. However, grid integration challenges—particularly in regions with high interconnection costs—continue to slow the deployment of intermittent resources.
1.3 Hybrid and Storage Solutions
Hybrid projects that combine solar or wind with battery storage are increasingly attractive. Grid‑scale lithium‑ion batteries now have a capacity factor of 45 % in the United States, translating to a LCOE of approximately $50 per megawatt‑hour. Solid‑state and flow‑battery technologies are in late‑stage development, promising higher energy density and longer life cycles that could further depress costs.
2. Storage Capabilities and Their Market Impact
2.1 Battery Storage
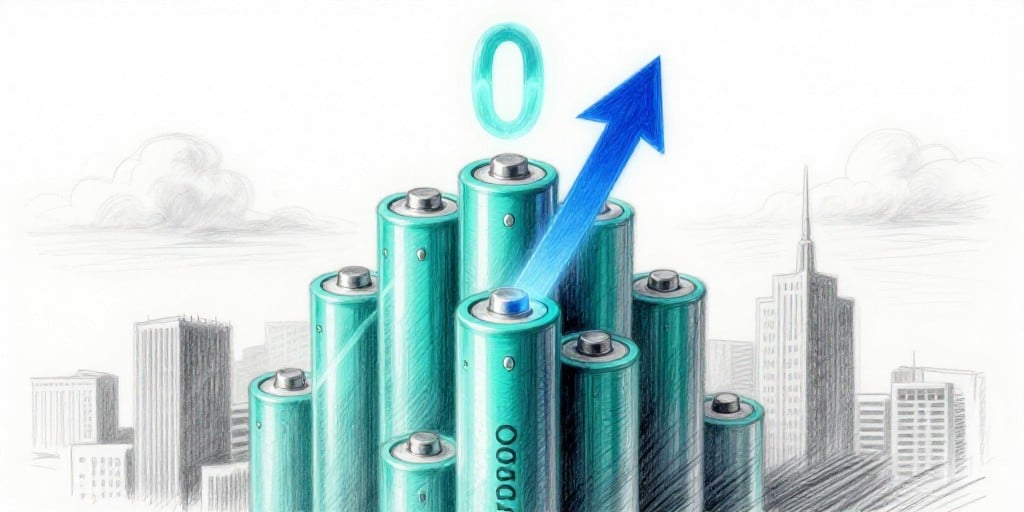
Battery storage remains the cornerstone of renewable integration. In 2026, cumulative battery storage capacity exceeds 20 GW worldwide, with the United States and China leading the market. The cost of new battery installations has fallen by 30 % since 2024, driven largely by economies of scale in lithium extraction and improved cathode chemistries. Battery storage now provides more than 30 % of peak demand in California and 25 % in Germany, underscoring its role in mitigating grid volatility.
2.2 Pumped Storage Hydroelectricity (PSH)
PSH continues to be the most mature large‑scale storage technology, offering 90 % round‑trip efficiency. Recent projects in Spain and Japan have leveraged advanced turbine designs that reduce friction losses, extending operational life by 15 %. PSH now contributes roughly 5 % of global installed capacity and is often paired with solar farms to provide both daytime and nighttime storage.
2.3 Emerging Storage Technologies
Hydrogen and compressed air energy storage (CAES) are gaining traction as long‑duration solutions. Hydrogen electrolyzers, powered by excess renewable output, are reaching economies of scale in the Middle East, where low-cost solar can support large‑scale green hydrogen production. CAES projects in the United States are exploring underground caverns as storage media, with pilot plants demonstrating 70 % round‑trip efficiency.
3. Regulatory Dynamics Shaping the Energy Transition
3.1 Carbon Pricing and Emission Standards
The European Union’s Emission Trading System (ETS) has expanded to include aviation and maritime transport, raising the price floor to €70 per tonne of CO₂. In the United States, the Inflation Reduction Act has implemented a 15 % carbon fee on coal, oil, and gas production, stimulating investment in low‑carbon technologies. China’s 2025 target of 65 % renewable penetration in its power mix is being enforced through a tiered subsidy framework that rewards grid‑connected renewable projects.
3.2 Grid Modernization Initiatives
The International Energy Agency (IEA) reports that over 40 % of power grids worldwide are undergoing modernization to accommodate distributed generation and storage. Smart‑grid technologies, such as advanced metering infrastructure (AMI) and automated demand‑response systems, enable utilities to balance supply and demand in real time, reducing the need for spinning reserves and lowering operating costs.
3.3 Policy Incentives for Renewables
Subsidy structures continue to evolve. Feed‑in tariffs (FITs) in India and Brazil have been replaced by market‑based mechanisms, prompting greater reliance on auction‑style procurement. In the United States, tax credits for renewable generation have been extended to 15 years, maintaining a stable investment horizon for developers. Offshore wind incentives in the United Kingdom have been adjusted to reflect the lower cost of capital, allowing projects to achieve break‑even LCOEs below $30 per megawatt‑hour.
4. Geopolitical Considerations and Their Energy Implications
4.1 U.S.–China Trade Tensions
Ongoing tariff disputes have impacted the supply chain for critical renewable components, such as silicon wafers and rare‑earth magnets. While the U.S. government has accelerated domestic manufacturing initiatives, the lag in production capacity has temporarily increased component costs by 10–15 %. Long‑term trade agreements are expected to mitigate these disruptions once the U.S. and China negotiate a stable framework for technology transfer.
4.2 Energy Security in the Middle East
The Middle East’s oil export revenues are declining, prompting governments to diversify into renewables. Saudi Arabia’s Vision 2030 includes a target of 58 GW of renewable capacity by 2030, with significant investments in solar parks and green hydrogen production. Geopolitical stability in the region is critical to sustaining these projects, as political unrest can disrupt both upstream oil operations and downstream renewable infrastructure.
4.3 Russia–Ukraine Conflict
The conflict has reshaped European energy security policies, accelerating the transition to renewables and gas imports from alternative sources. The European Union’s energy emergency plan, which includes temporary reductions in natural‑gas tariffs and increased imports from the United States and Norway, has led to higher volatility in gas prices but also stimulated investment in domestic renewable projects as a hedge against geopolitical risks.
5. Economic Factors Influencing Market Dynamics
5.1 Capital Expenditure (CapEx) and Operational Expenditure (OpEx)
CapEx for renewable projects has fallen by 25 % since 2022, primarily due to reductions in turbine costs and improved project financing terms. OpEx for solar PV has decreased by 15 % thanks to advances in module durability, whereas wind turbines now benefit from predictive maintenance powered by IoT sensors, reducing downtime by 20 %. In contrast, the OpEx for fossil‑fuel plants is rising due to stricter environmental compliance requirements and the need for carbon capture and storage (CCS) systems.
5.2 Commodity Prices
Crude oil prices have stabilized around $80 per barrel, while natural gas spot prices in the U.S. have fluctuated between $3 and $5 per million British thermal units (MMBtu). The price differential between natural gas and electricity (measured in $/MWh) has narrowed, making gas-fired peaker plants more economically attractive for short‑term dispatch. However, the long‑term trajectory favors renewables as their LCOE continues to decline.
5.3 Investment Climate
Global equity markets have exhibited heightened volatility, yet renewable energy ETFs have returned 18 % over the past year, outperforming the broader MSCI World Index by 4 %. Institutional investors are increasingly incorporating climate risk into portfolio construction, leading to higher demand for green bonds and renewable infrastructure funds.
6. Conclusion
The energy markets of 2026 are characterized by a dynamic shift from traditional fossil‑fuel production toward renewable generation, driven by falling costs, supportive regulatory frameworks, and geopolitical imperatives. Storage technologies—particularly battery storage—are central to this transition, providing the flexibility needed to balance intermittent renewable output. While traditional energy producers face increasing regulatory pressure and higher operational costs, they remain integral to the global energy mix, especially in regions where renewables are still maturing.
For investors and industry stakeholders, the confluence of technological innovation, policy evolution, and geopolitical developments presents both opportunities and risks. Strategic capital allocation toward low‑carbon projects, coupled with robust risk management practices, will be essential to navigate the evolving energy landscape successfully.